Findings
The Women's Rights Recommendation and Compliance Database shows that both recommendation quality and compliance vary over time, across and within human rights institutions, across states, and even within country. By unveiling these variations, the Women's Rights Recommendation and Compliance Database illustrates that the process of issuing and complying with international human rights recommendations is far more nuanced and complex than existing research and data would suggest.
Regional Trends in Compliance
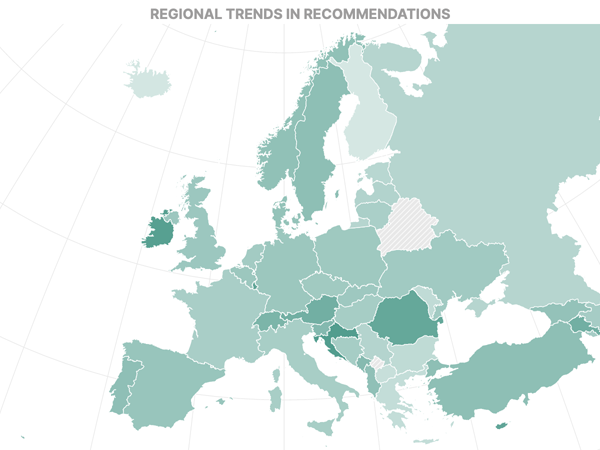
How does compliance vary across states in Europe? This figure shows the proportion of recommendations for which states were fully compliant out of the total number of recommendations for each state from 2007-2016. Darker colored states represent states with the highest proportion of recommendations coded as compliant, while lighter colored states are those with the lowest proportion of recommendations coded as compliant.
States with the highest proportion of recommendations in full compliance were Croatia (0.672), Monaco (0.666), Ireland (0.653), Cyprus (0.615), and Luxembourg (0.611). States with the lowest proportion of recommendations in full compliance were San Marino (0), Finland (0.164), Iceland (0.171), Macedonia (0.217), and Greece (0.233). For states with the lowest proportion of recommendations coded as fully compliant, this figure does not display the extent to which they took other actions in the compliance process (e.g. consideration, delegation, execution), only that these states had the lowest proportion of fully compliant recommendations.
The regional patterns displayed in this figure raise some interesting questions, such as: What state-level factors influence the likelihood of full compliance? Do democratic institutions generate a greater willingness to fully comply? To what extent does state capacity contribute to a greater likelihood of full compliance?
Regional Trends in Compliance
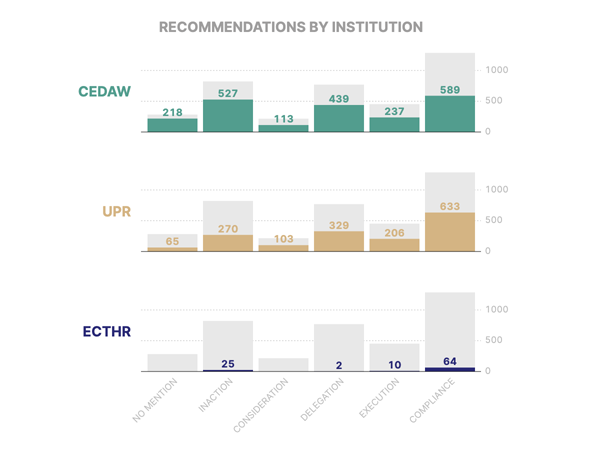
Compliance Rates by International Institution
How frequently do states comply with international women's rights recommendations? This figure shows that for CEDAW, the UPR, and the ECtHR, compliance (partial or full) is the most frequently coded category, followed by inaction. This pattern in the data suggests that states do not treat all recommendations equally, and that compliance and inaction are quite common.
These patterns raise interesting questions, such as: Does the quantity or density of (similar) recommendations influence the likelihood of state compliance with recommendations? Do the structure and design of international institutions, including institutional processes for monitoring, influence the likelihood of compliance? To what extent do the steps in the compliance process vary systematically across international institutions and why?
Looking across international institutions, CEDAW made the most recommendations from 2007-2016, followed by the UPR, and the ECtHR.
Notably, for CEDAW, partial or full compliance is the most frequently coded category, with around 28 percent of recommendations for which states provided compliance information resulting in partial or full compliance, while around 25 percent of CEDAW recommendations resulted in inaction. The UPR displays a slightly different pattern. Similar to CEDAW, partial or full compliance is the most frequently coded category for the UPR as well, with close to 40 percent of UPR recommendations resulting in partial or full compliance. However, only around 17 percent of UPR recommendations resulted in inaction. The most frequently coded compliance category for the ECtHR was full or partial compliance, with around 63 percent of ECtHR recommendations for which states provided compliance information resulting in full compliance and only 25 percent resulting in inaction.
Compliance by International Institution
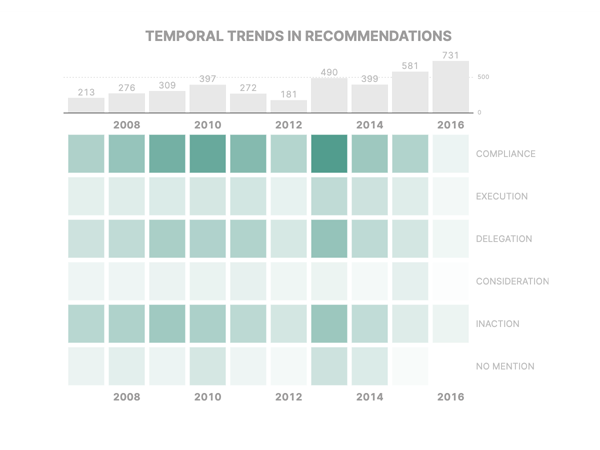
Compliance Over Time
How do compliance patterns change over time? This figure displays the trends in compliance over time for all three international institutions, where darker colored cells indicate a greater number of recommendations were coded in a particular compliance category during that year. Interestingly, there are spikes in both inaction and compliance in 2010 and 2013 for all three institutions. For all years, delegation was coded most frequently in 2010, 2011, 2013, and 2014.
Notably, recommendations from CEDAW and the UPR are not made annually, but rather every few years when states are under review, which means uneven compliance over time may be partly attributed to the behavior of international institutions and the characteristics of the particular subset of states that are being assessed each year. The receipt of ECtHR recommendations varies based on how many adverse judgments were rendered by the Court that also generated recommendations in a particular year.
The temporal patterns raise interesting questions, such as: "Do international institutions behave strategically in terms of the selection of issues they choose to assess and highlight each year? Do international institutions seek to protect their legitimacy by making some recommendations to states in years where they expect a higher likelihood of compliance?